Has Product “Style Drift” Changed How Indexed UL Should Be Evaluated
The far too narrow focus on outsized income projections in accumulation Indexed Universal Life products has caused advisors and clients alike to look past alternative product offerings that may more closely match their client’s appetite for risk.
Indexed Universal Life has been the dominant permanent insurance product for some time now, and it has changed dramatically from its early days. What was once marketed and sold as a way to protect against market losses is now positioned by many as a way to deliver eyepopping internal rates of return based on what many consider artificially high income projections on policy illustrations. This “style drift” away from the original value proposition calls into question the relative risk of these products, as well as their transparency. The result? A considerable proportion of clients who purchase an Indexed UL product might be better served by a Whole Life product.
The question of who is taking on risk in an insurance transaction is an interesting one. Left to their own devices, most insurance buyers will immediately think they are transferring risk to the insurance company. In terms of policy death benefits, they are spot on in that assumption. What they often miss, however, is the question of who is taking on the “investment risk” relative to the policy they are considering.
At a fundamental level, this question comes down to who is directing the investment of any premiums in excess of policy charges and expenses. In Whole Life and Indexed Universal Life, the insurance company is making the “investment decisions” regarding those funds. In exchange, the client’s policy is credited with some level of return, both on a guaranteed and current basis. While the insurance company is contractually obligated to deliver on the guaranteed return, the current side, including dividends and index strategy returns, are based on the insurance company’s actual returns in some way. This is particularly true when we consider timeframes longer than a single policy year, which is absolutely necessary given the decades-long timeline permanent insurance products operate on.
In both instances, the insurance company is making the “investment decisions”, not the client, and then setting the terms for the next policy year. This lack of control over how excess funds are invested is where the client is taking on risk, perhaps without realizing they are doing so. In order for their insurance strategy to perform as illustrated, the insurance company needs to deliver at the illustrated return or higher. What happens if the insurance company can’t meet those return expectations? That’s where things get interesting.
In Whole Life products, assuming the design is all base, the policy will still be on track to endow at maturity, and the policy holder will not be required to increase their premiums. They will, however, see lower projected future total cash value and income versus the initial sales illustration. For Indexed Universal Life, the story can be quite different. For accumulation-focused products, there is no guaranteed performance other than the floor of 0% on the indexed account. Cash value can, in fact, fall year over year based on policy charges. Projected cash value will be lower versus the initial sales illustration, as will income.
On the surface, that doesn’t seem that different. However, a quick look at the real world exposes significant differences. Figure 1, below, shows the average dividend rate over the last twelve years for a handful of insurance companies that are household names.

Yes, there is variance. The average dividend rate from 2013 to 2024 across these companies dropped from 6.50% to 5.87%, a 9.69% decrease. Using a currently available Whole Life product, decreasing the dividend rate by this percentage from policy inception translates to a drop in projected income of 14.79%. In the real world, this decrease in dividend rate would not happen all at once, of course, so the actual impact to in force Whole Life products would be far less.
Figure 2 below, shows the Maximum Illustrative Rate for a selection of commonly sold Indexed UL companies. The changes here are far more dramatic and have far greater impact on policy performance as a result.
Figure 2: Average Maximum Illustrative Rate, 2013–2024, Major Indexed UL Carriers
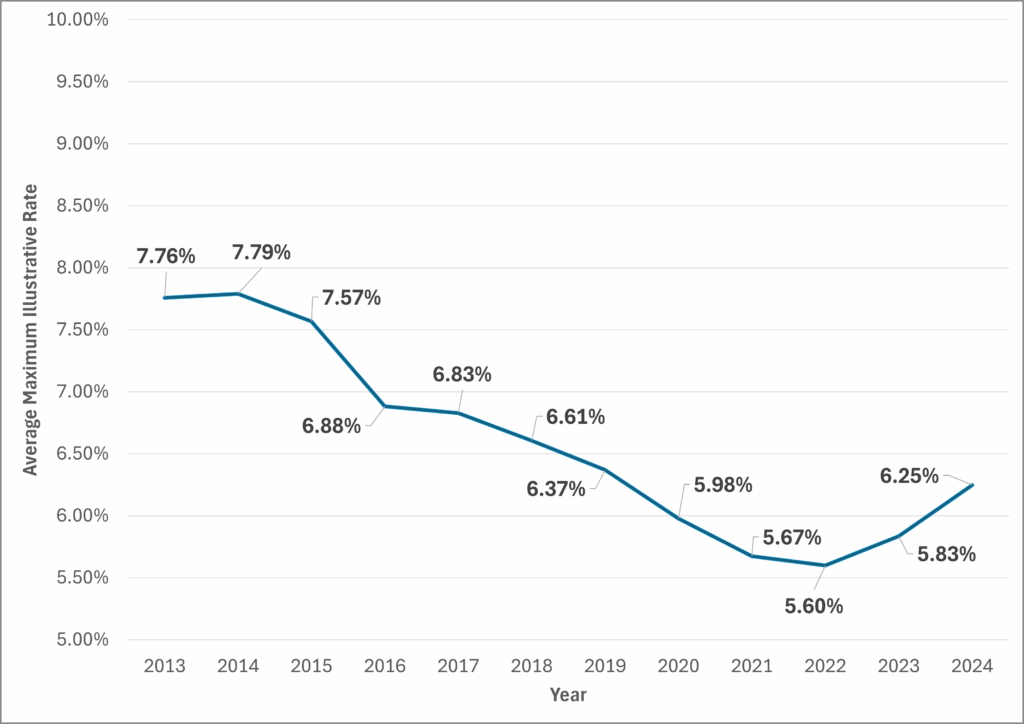
The average maximum illustrative rate from 2013 to 2024 dropped from 7.76% to 6.25%, a 19.35% decrease. Using a currently available Indexed Universal Life product, decreasing the maximum illustrative rate by this percentage from policy inception translates to a drop in projected income of 34.78%. In the real world, this decrease would not happen all at once, of course, so the actual impact to in force Indexed Universal Life products would, again be far less, just as it was for Whole Life.
What would this mean in terms of dollars and cents? Table 1 summarizes the projected income for both products at current as well as decreased rates.
Table 1: Whole Life vs. Indexed UL

Based on this data, one can make the argument that Indexed UL offers more volatility, and therefore risk, in both directions. Yes, the client is protected against losing money in the index, but in terms of the strategy delivering on their expectations as set by the initial sales illustration, the client is taking on significant risk. While there will also be volatility in Whole Life, the magnitude is simply different, absent a period of historically high interest rates that are not likely to be repeated. Yes, there is less upside potential, but there is also less downside risk compared to the initial sales illustration. In addition, the reduced income in the Whole Life product is far in excess of the reduced income from the Indexed UL. A client who understands all of this may, in some instances, elect for the more conservative approach as the one they are most comfortable with.
For that conservative client, this means a Whole Life product is the more appropriate product based on their appetite for risk. It also shines a light on considering an insurance company’s Cap and Participation rate histories on in force Indexed Universal Life policies in addition to policy expense loads when evaluating the relative risk of an Indexed Universal Life policy.
It also suggests a fundamental question: If you are giving up control, what can you expect in return? The answer is different for each product type. In addition, some clients may not want to give up that control. For them, a Variable Universal Life product transfers the death benefit risk to the insurance company but maintains client control over the investment decisions. All in, understanding this fundamental issue of who controls what element of a life insurance policy likely ends up with more clients electing a Whole or Variable Life policy rather than an Indexed product. Finally, and importantly, this is not a matter of one product type being “superior” to another. Rather, one will be more suitable based on the client’s objectives and risk tolerance.
Have questions or want to discuss how this applies to your clients? Reach out to your Cavalier Associates Marketing Consultant for additional information.
Not sure who to contact? Please call the office @ (800) 350-2019 for assistance.
Related Articles


The contents of this document should not be considered as tax or legal advice. Any information or guidance provided is solely for educational or informational purposes and should not be relied upon as a substitute for professional advice. It is always recommended to consult with a licensed financial or legal advisor for specific guidance related to your individual situation.